
Multi-physics: Phase Shifter
Highlighted features: heat_only electrodes, voltage, electrostatic(), the linear electro-optic (Pockels) effect, and VpiL for an x-cut LNOI phase shifter.
This code example is licensed under the BSD 3-Clause License.
import emodeconnection as emc
import matplotlib.pyplot as plt
import numpy as np

## Simulation parameters
wavelength = 1550  # [nm]
dx, dy = 20, 20  # [nm] resolution
w_core, h_film, h_ridge = 1000, 500, 250  # [nm] 1 um ridge etched 250 nm into a 500 nm film
h_box, h_tclad = 2000, 1000  # [nm] SiO2 cladding above and below the film
w_el, h_el = 4000, 300  # [nm] Au electrodes
gap = 2500  # [nm] gap from the ridge edge to the nearest electrode edge
V = 10.0  # [V] applied between the two electrodes

opt_width = w_core + 2 * 2000  # [nm] optical window: wide enough for the mode
es_width = w_core + 2 * gap + 2 * w_el + 2000  # [nm] electrostatic window: spans both electrodes
window_height = h_box + h_film + h_tclad

## Connect and initialize EMode
em = emc.EMode()

em.settings(
    wavelength=wavelength,
    x_resolution=dx,
    y_resolution=dy,
    num_modes=1,
    background_material='SiO2',
    window_width=opt_width,
    window_height=window_height,
)

## x-cut LNOI ridge: the optic axis (z, extraordinary) lies along sim-x.
ln_x_cut = emc.MaterialSpec(material='LN_MgO', theta=np.pi / 2)

em.shape(name='BOX', material='SiO2', height=h_box, fem_resolution=300)
em.shape(
    name='LN',
    material=ln_x_cut,
    fill_material='SiO2',
    height=h_film,
    mask=w_core,
    etch_depth=h_ridge,
    fem_resolution=40,
)
em.shape(name='tclad', material='SiO2', height=h_tclad, fem_resolution=300)

## Au electrodes beside the ridge, out of the optical mesh (heat_only), at +-V/2.
y_el = h_box + h_film + h_el / 2
x_el = w_core / 2 + gap + w_el / 2
em.shape(
    name='electrode_L',
    material='Au',
    width=w_el,
    height=h_el,
    position=(-x_el, y_el),
    voltage=V / 2,
    fem_resolution=100,
    heat_only=True,
)
em.shape(
    name='electrode_R',
    material='Au',
    width=w_el,
    height=h_el,
    position=(x_el, y_el),
    voltage=-V / 2,
    fem_resolution=100,
    heat_only=True,
)

## Unbiased mode
em.FDM()
em.report()
n0 = em.get('effective_index')[0]

## Electrostatic solve: a wider window so both electrodes are inside the mesh
em.settings(window_width=es_width)
static_data = em.electrostatic()

## Biased mode, back on the optical window: FDM folds the r-tensor perturbation in
## automatically. The bias makes the permittivity a full tensor, so this solve is
## slower than the unbiased one.
em.settings(window_width=opt_width)
em.FDM()
em.report()
nV = em.get('effective_index')[0]
dn = nV - n0

## V_pi*L is independent of length: a length L giving a pi phase shift at
## voltage V satisfies (2*pi/wavelength) * dn * L = pi, so V*L = V * wavelength / (2*dn)
V_pi_L_V_cm = V * wavelength * 1e-9 / (2 * abs(dn)) * 1e2  # [nm] -> [m] -> [cm]
print(f'Effective index shift at {V:.0f} V: {dn:.2e}')
print(f'V_pi * L: {V_pi_L_V_cm:.2f} V*cm')

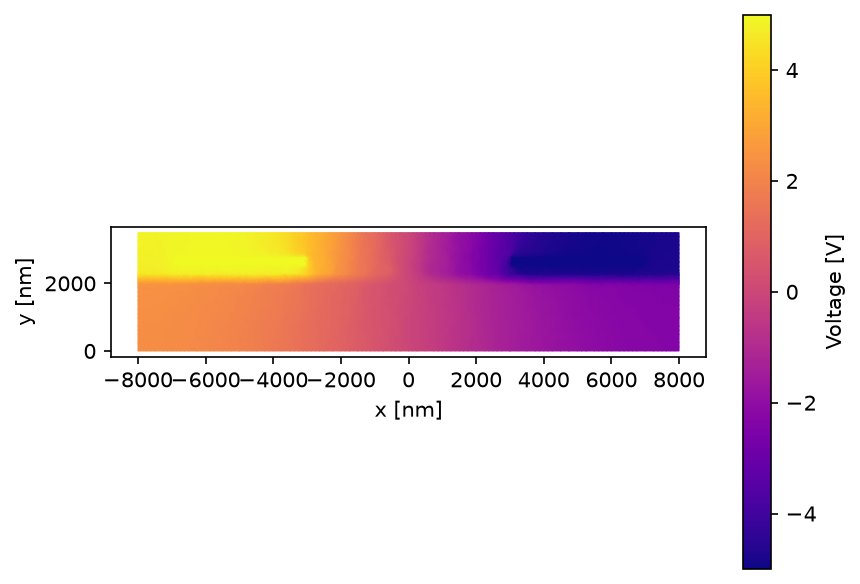
## Voltage map
fig, ax = plt.subplots()
im = ax.tripcolor(
    static_data['p'][0],
    static_data['p'][1],
    static_data['t'].T,
    static_data['voltage'],
    cmap='plasma',
    shading='gouraud',
)
ax.set_aspect('equal')
ax.set_xlabel('x [nm]')
ax.set_ylabel('y [nm]')
fig.colorbar(im, ax=ax, label='Voltage [V]')
fig.savefig('phase_shifter_voltage.png', dpi=150, bbox_inches='tight')

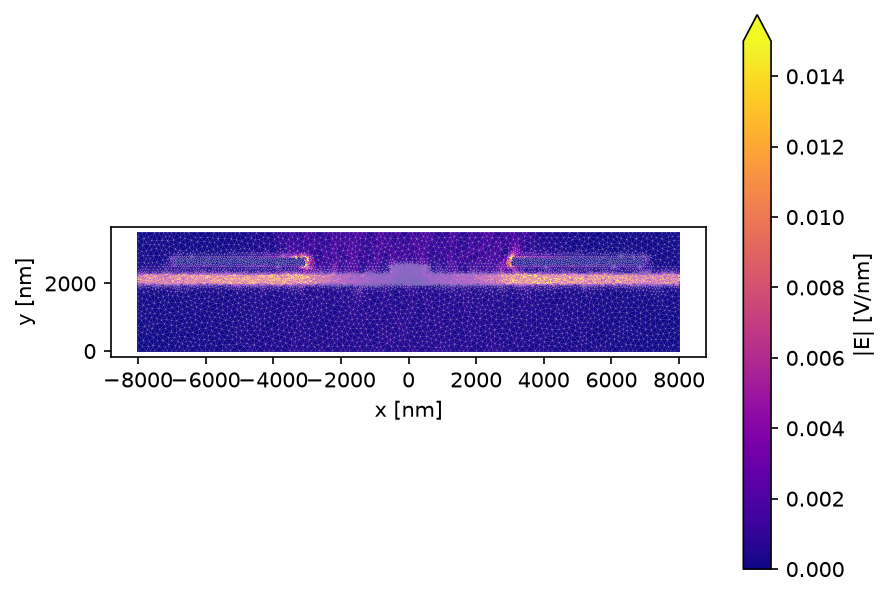
## Field magnitude map (per-element, so plotted at the mesh element centroids).
## The color scale is capped below the peak: the field diverges at the electrode
## corners, which would otherwise wash out the waveguide.
E_mag = np.hypot(static_data['Ex'], static_data['Ey'])
fig, ax = plt.subplots()
im = ax.tripcolor(
    static_data['p'][0],
    static_data['p'][1],
    static_data['t'].T,
    facecolors=E_mag,
    cmap='plasma',
    vmin=0,
    vmax=0.015,
)
ax.triplot(
    static_data['p'][0], static_data['p'][1], static_data['t'].T, color='w', lw=0.15, alpha=0.4
)
ax.set_aspect('equal')
ax.set_xlabel('x [nm]')
ax.set_ylabel('y [nm]')
fig.colorbar(im, ax=ax, label='|E| [V/nm]', extend='max')
fig.savefig('phase_shifter_field.png', dpi=150, bbox_inches='tight')

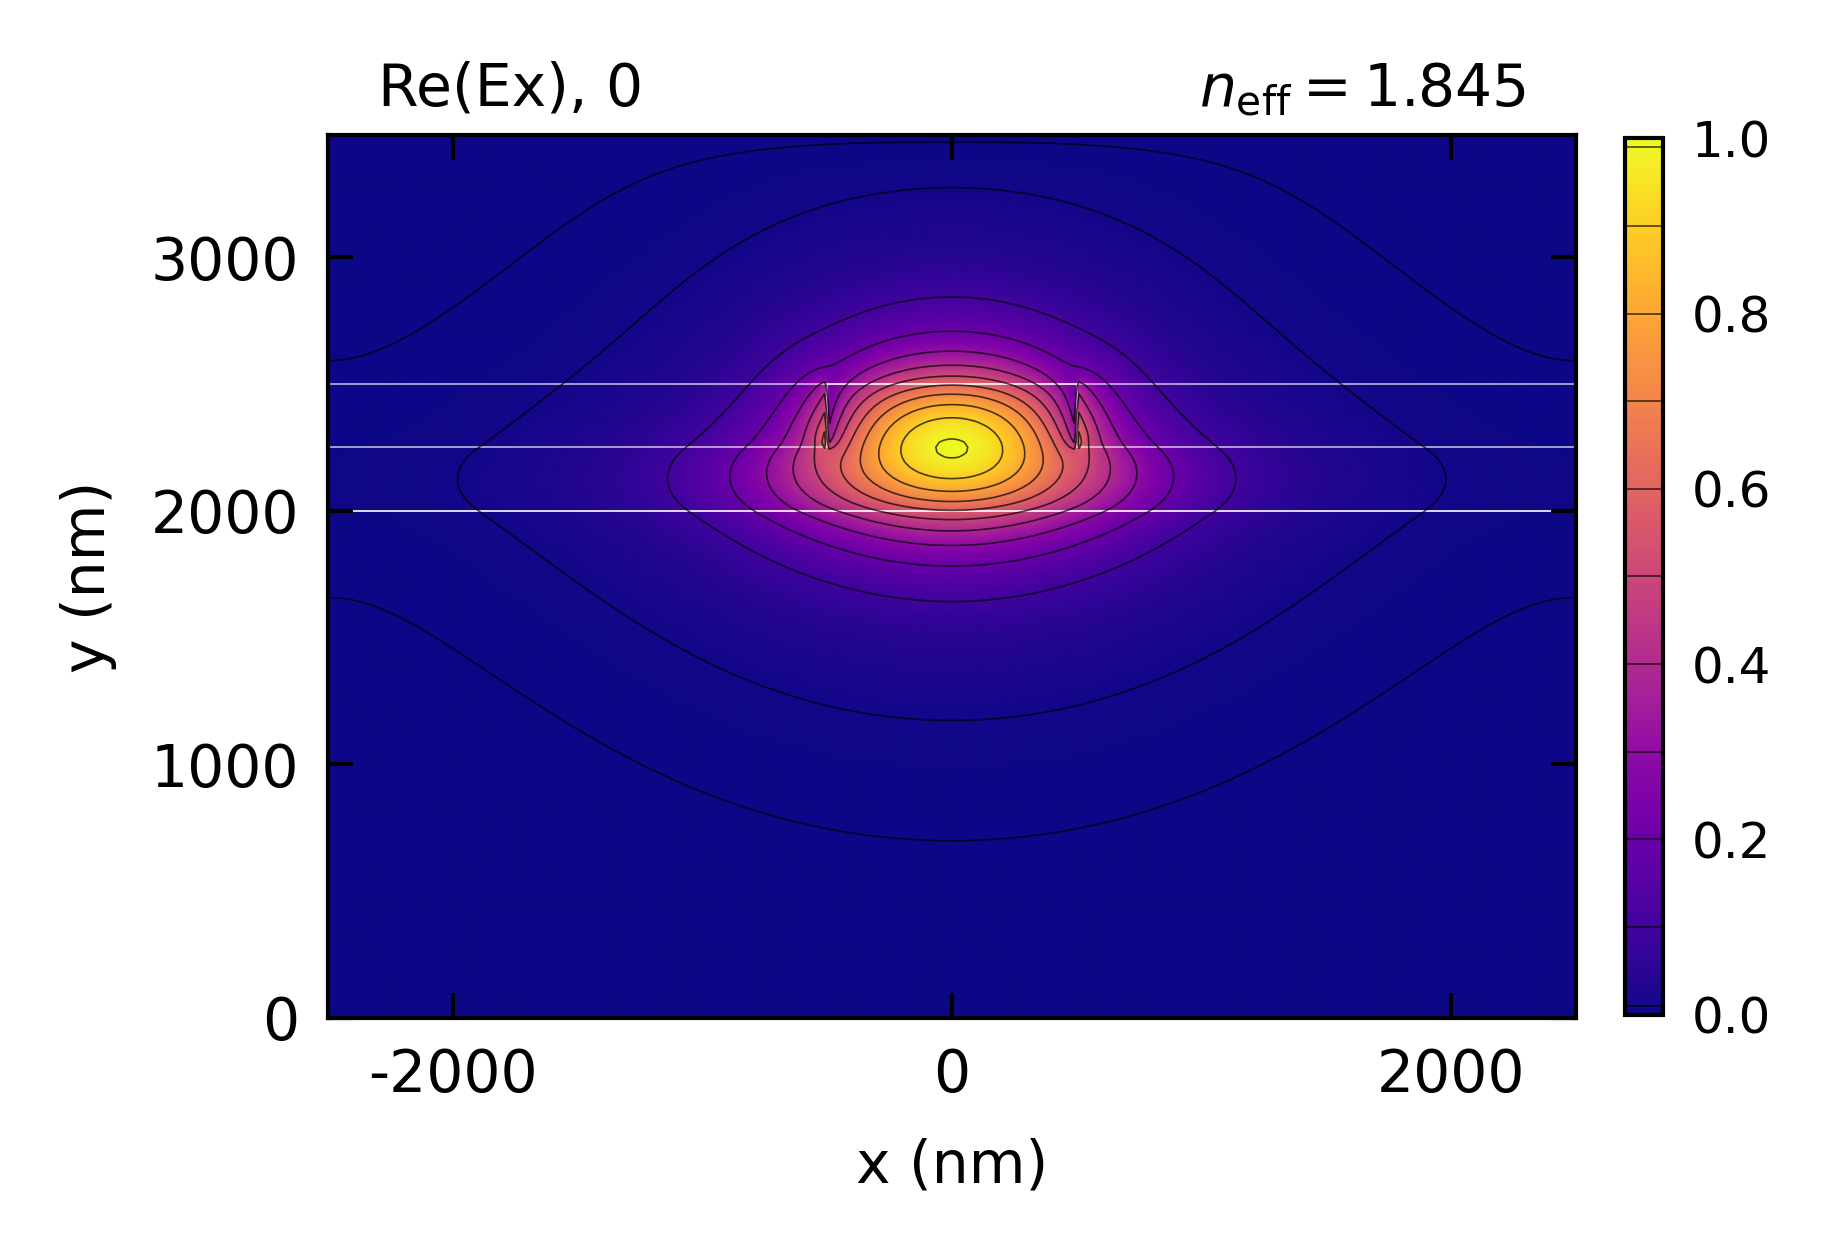
em.plot()

em.close()
Console output:
EMode3D 1.0.6 - email
Meshing completed in 1.1 sec
Solving modes completed in 1.6 sec

Wavelength: 1550.0 nm    Solver: FDM

  Mode #     n_eff    TE %    Loss (dB/m)
--------  --------  ------  -------------
    TE-0  1.844836  99.6 %          0.000

Solving electrostatic completed in 0.2 sec
Meshing completed in 1.1 sec
Solving modes completed in 5.0 sec

Wavelength: 1550.0 nm    Solver: FDM

  Mode #     n_eff    TE %    Loss (dB/m)
--------  --------  ------  -------------
    TE-0  1.844692  99.6 %          0.000

Exited EMode
Effective index shift at 10 V: -1.44e-04
V_pi * L: 5.39 V*cm
Figures: